Cause and Effect Analysis of a Two-Stage Tempering System
 Jeff Gwirtz
In my previous two Milling Journal articles, “Monitoring an Automated Tempering System,” Third Quarter 2023, and “Management of Tempering Moisture Data,” Fourth Quarter 2023, various wheat tempering data collection and analysis methods were considered.
In the first article, I wrote about the challenge of limited manually collected data availability. In the second article, the importance of multiple measures to better estimate the average moisture and the standard deviation, which helps to better represent moisture uniformity in an automated or manual tempering system was presented.
In this article, the performance of a complete, two-stage tempering system is presented. The purpose is to consider tempered wheat moisture variability and suggest a cause-and-effect approach analysis to identify potential sources of tempered wheat moisture variability.
Wheat moisture content was measured for incoming dry wheat, wheat after the first tempering rest period, and after the second tempering rest period prior to first break (B1).
The wheat at each point was the same wheat mix, and the moisture measurements were made using the same NIR equipment. Immediately upon collection, the samples were sealed in plastic bags and taken to the laboratory for analysis. The samples represent a planned mill run of several hours of a specific mill mix or grist.
FIGURE 1
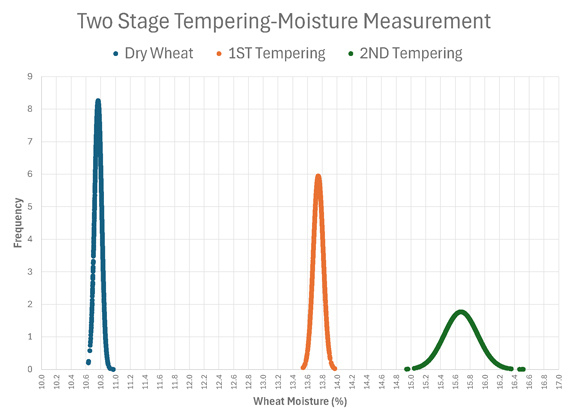
Table 1: Moisture content of wheat at various steps in a two-stage tempering system.

Table 1 above shows the moisture measurement results and sample numbers for dry wheat, wheat after the first temper rest period and wheat after the second temper rest period moving to B1. The two tempering systems were identical in terms of equipment selection, construction, and operation.
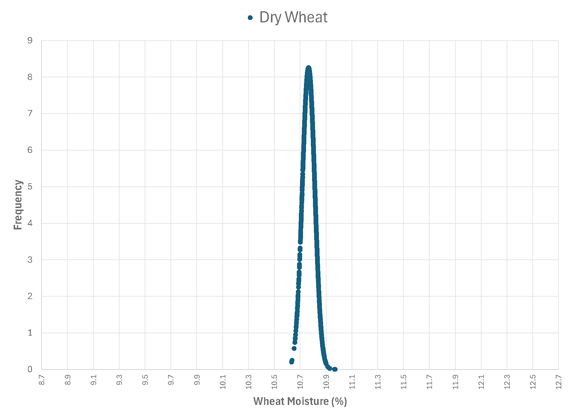
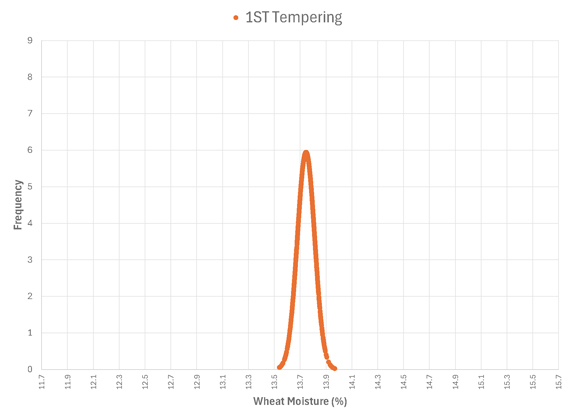
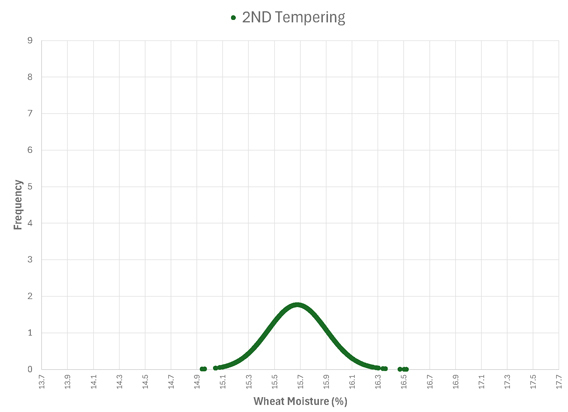
Dry wheat moisture content was uniform with an average of 10.77% moisture with a standard deviation of 0.05%. Wheat after the first tempering step was similarly uniform with an average moisture content of 13.75 % and a standard deviation of 0.07%. Wheat after the second tempering step going to B1 had an average moisture content of 16.68% with a standard deviation of 0.23%. The operation of the two tempering systems appears to have increased moisture content variability.
Figure 2
A Closer Look at Moisture Variability
Variation is more easily observed and realized in Figure 2 above. The three curves represent the normal distribution of 1,500 randomly generated moisture values for each of the three sample sets based on the statistical parameters reported in Table 1. (A brief review regarding considerations for using randomly generated numbers is presented in my previous article.)
Each of the three curves are a typical bell shaped exhibited by normal distribution. They reflect the intention of the miller to increase the initial dry wheat moisture in the first tempering step, followed by the final addition of moisture in a second tempering step to a target level for the milling operation. Wheat moisture content and range for each distribution is shown on the horizontal axis, while the frequency of moisture occurrence is reflected in the curve height at the respective moisture level.
Figure 2 presents the same data as Figure 1 modified with each graph retaining a common vertical axis (0-9) for frequency but roughly aligning the moisture around the average moisture on the horizontal moisture axis scale set approximately 2% from the average moisture content. The moisture variation of dry wheat is reasonable, well-reflected, and maintained in the moisture content of wheat after the first tempering process.
TABLE 2 Empirical Rule Observation Range

Challenges of Standard Deviation
However, the moisture content variation of wheat moving from the first tempering process through the second tempering process to B1 is dramatically increased from 0.07% to 0.23%.
The increase in standard deviation moving through the tempering process is cause for concern given the application of the empirical rule, also called the “three-sigma” or “68-95-99.7” rule for normally distributed data. In a normal distribution, 68% of the observations will fall within plus-or-minus one standard deviation from the mean, 95% will fall within plus-or-minus two standard deviations from the mean, and 98.7% of the observations will fall within plus-or-minus three standard deviations from the mean.
Table 2 above shows the empirical rule observation ranges, the expected observed range, and lower and upper moisture percentage for the range for dry wheat, 1st Tempering Wheat, and 2nd Tempering wheat.
Given a commercial bushel of wheat weighing 60 pounds (approximately 27.27kg) as a single lot, and measuring moisture content of as many samples as possible from the lot, it is expected that nearly all measurements would fall within 0.2% of the average moisture content. This assumes the moisture measuring device is properly calibrated and the procedure is properly followed for each measurement.
Both Dry Wheat and 1st Tempering Wheat moisture ranges appear to be within 0.20% of the average moisture values for multiple measures of the same wheat lot. Components of the 1st Tempering system were properly measuring dry wheat moisture and controlling water addition based on the target and measured flow rate of dry wheat.
The 2nd Tempering system did not perform as well as the 1st Tempering system, as the range of observable moisture content of wheat delivered to B1 ranged from 14.99-16.37%.
Such a range presents both operational and economic consequences. Moisture variation impacts mill balance by altering break release control, purification settings, sifting efficiency, bran clean-up, color, ash, yield, mill capacity, productivity, flour quality, and moisture gain or loss. Any combination of these factors can impact the mill’s economic performance. A systematic analysis is needed to identify sources of increased moisture variation observed in the 2nd Tempering System.
Keep in mind achieving a specific tempered wheat moisture in this system requires knowing the moisture content of dry wheat, the dry wheat flow rate, and the target moisture at the given tempering step. Automation allows for continuous monitoring of wheat moisture and flow rate, facilitating real-time adjustment of moisture addition to create a tempered wheat with uniform moisture content.
A point to consider is the system’s capability in reacting to inherent variability of dry wheat moisture flow rate. The time lapse between measured flow rate and moisture measurement relative to the point of moisture addition should be considered.
Electronic measurements can be made, data analyzed, and water controller adjustments made nearly instantaneously. The dry wheat whose moisture was measured and dry wheat rate measured and the calculated amount of water required may or may not arrive to the point of application at the perfect time.
Analysis Tools
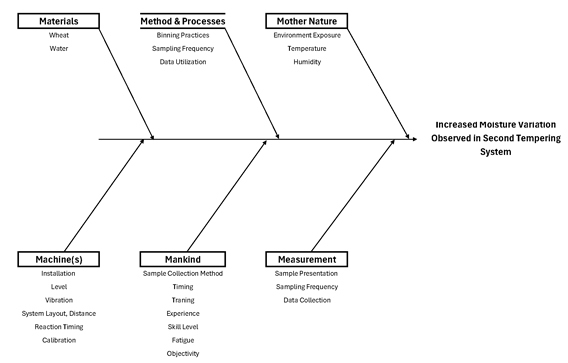
In this installation, there appear to be performance differences which should be reconciled. One analysis tool to consider is the development of an Ishikawa diagram, also known as a fishbone diagram or cause-and-effect diagram.
The Ishikawa diagram is a tool common to many quality management philosophies such as TQM (Total Quality Management), ISO-9000, Six-Sigma, Lean Manufacturing, and Kaizen. It is used to explore possible causes of variation.
Figure 3 below presents an initial framework of an Ishikawa diagram focused on identifying causes or sources of variation between two reportedly identical tempering systems resulting in increased tempered wheat moisture variability between two stages of wheat tempering. Six categories (6-M’s) including Material, Method or Process, Mother Nature, Machine, Mankind, and Measurement have been initially identified in Figure 3.
FIGURE 3 Ishikawa Diagram for Analyzing Variation
Data Collection Considerations
As presented, it is not a complete picture, as there are both manual and automated measurements and controls considered in addition to potential differences in a physical system that may not have been identified. In addition, each system has many components or machines (weighing, moisture, and flow sensors, control valves, conveying systems, tempering mixers, level indicators, etc.) that must be considered with potential sources of variation identified including relative position. Even differences in spouting angles and orientation of sensors may impact system performance.
Manually and automatically collected data may not be used in the same fashion, requiring additional branches or sub-branched under each heading. While manually collected data is easier to observe, errors in data entry may lead to false conclusions.
With automated data collection and reporting, one must examine in detail when data is collected, collection failures and utilization in the automation system. For example, how is incorrect data or missed data handled in providing system feedback and control? In the case of a system measuring incoming wheat moisture every 30 seconds but programmed to use a running average of 10 observations, how is the data used and water addition rate set as the running average is not yet available? In five minutes of operation, a considerable amount of wheat passes though the tempering system of a mill producing 4,000 cwts. of flour per day.
Elimination of variability is critical in optimizing process performance, which impacts product quality uniformity and economic performance of the milling unit. Details are important, including what data is collected and utilized in ether a manual or automated system.
Dr. Jeff Gwirtz is CEO of JAG Services, Inc., an international consulting company in Lawrence, KS; 785-341-2371; jeff@jagsi.com.
He also is adjunct professor in the Department of Grain Science and Industry at Kansas State University, Manhattan.