State Percent Complete
Texas 100%
Oklahoma 100%
Kansas 100%
Colorado 100%
Nebraska 100%
Wyoming 100%
South Dakota 100%
Montana 90%
Idaho 85%
Washington 100%
Oregon 100%
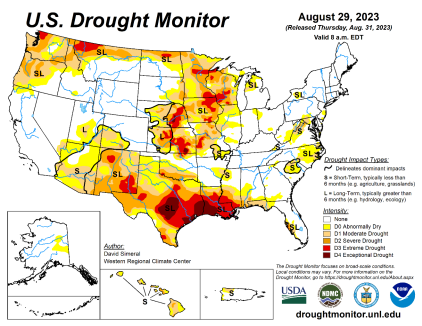
- Kansas – Wheat Scoop will be published this week. There is limited seed availability and tighter supplies for desired varieties. USDA/NASS publication coming out next Friday with KS data. Soil moisture is dry for planting.
- Colorado – Areas that received timely May/June rains are higher yielding. Excellent subsoil moisture, but topsoil moisture is dry – in some areas too dry to plant. NE Colorado has been getting rain and a few producers have started planting. Most of planting should start around Sep. 10. Acres holding steady but could go up slightly.
- Minnesota – Above average overall; producers pleasantly surprised. Slow maturing and limited harvest time (2-3 hours/day) due to humidity and isolated showers. No falling number or quality issues reported. No low protein reported.
- PGI/USDA – Only 2-3 samples received since last week and no additional composite data this week. 462 samples. Baked 4 composites with similar performance to previous weeks. Overall, quality looks good. Expect remaining samples on Tuesday.
- WMC – 84% of expected SW samples received. Minimal change from last week. Heavier TKW. Most of delayed samples are from lower protein regions, so expect protein to slightly decrease. Farinograph and SRC data show typical SW values. For White Club, stable results with a wheat protein of 10.6%. Good quality HRW/HRS with TW and wheat protein values similar to 5YA.
- Mignon/BNSF – Fertilizer is up as well as higher spring wheat exports, offsetting lower winter wheat volumes. Running under 100 shuttles currently ramping up to 155 in October. Lower corn and milo exports offsetting higher domestic corn/wheat movement; grain products up yoy on Renewable Diesel business.
Physical Characteristics
Samples | Exp | MST | Pro% | DKG | TKW | FN | Grade | Test Weight | FM | DMG | S&B | DEF |
462 | 474 | 11.7 | 12.7 | 0.8 | 29.9 | 365 | 2 | 59.8 | 0.2 | 0.5 | 0.9 | 1.6 |
Milling
Composites Milled | Extraction % |
63 | 75.93 |
Extraction rates are slightly lower than last year.
Flour/Dough
Samples | Flour Ash(14% mb) | FARINOAbs (14% mb) | ALVEOP (mm) | ALVEOL (mm) | ALVEOW (mm) | MIXO WaterAbs(14% mb) |
63 | .54 | 57.8 | 77.4 | 108.1 | 261.9 | 64.6 |
Baking Characteristics
Samples | Mix Time(min) | Bake Absorption(14% mb) | Loaf Volume (cc) | Crumb Grain(1-10) | Crumb Texture(1-10) |
63 | 4.05 | 64.5 | 923.7 | 5.8 | 6.3 |
Bakers will be very pleased with a functional flour.
**The data is a straight average of all the samples that have gone through all tests. Due to rounding and the way information is presented and being early in the sampling, these numbers will change when weighting factors are calculated.**